Scaling from 500 to 50,000 Concurrent Users
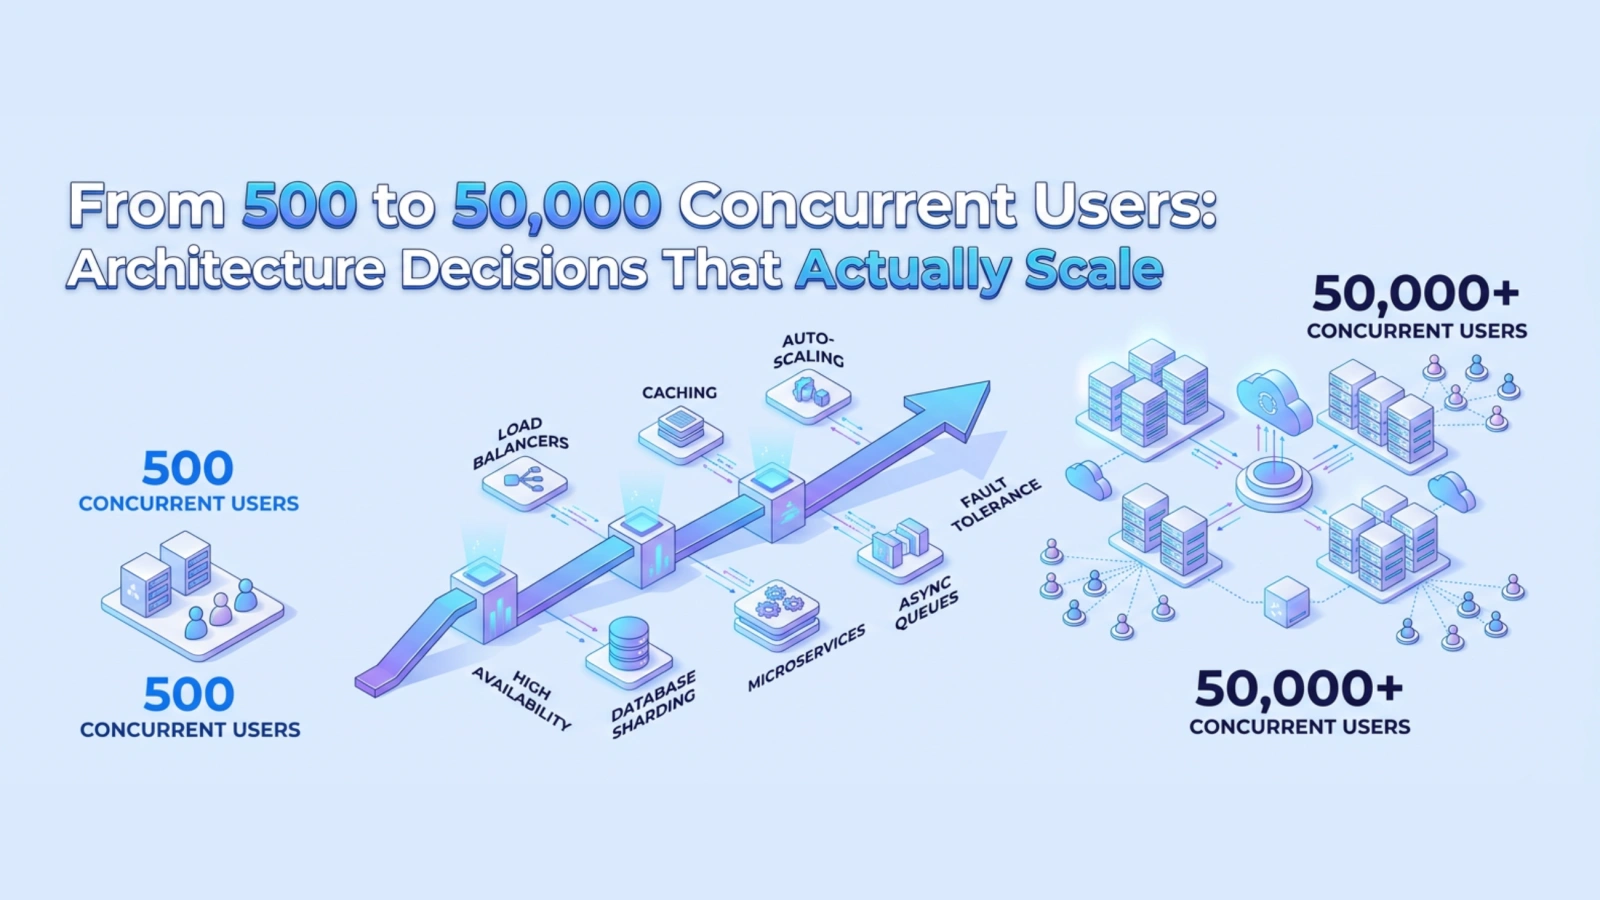
Surviving a traffic spike is mostly a question of what you fixed months earlier, because the things that break under load are rarely the things you can change while under load. The platform this is drawn from was a two-million-product store migrated from Magento to headless Next.js, and it went through Black Friday holding 99.99% uptime at 12,000 concurrent users. Nothing about that number was luck, and almost none of the work that produced it happened during the event. What follows is what actually needed scaling, what turned out not to matter, and the sequence that worked — starting with the database, because in every load problem I have investigated, the database was either the bottleneck or one layer away from it.
Start with the database, not the application servers
Application servers are the tempting place to start because they are trivially horizontal. Add instances, add capacity. That is exactly why they are almost never the real constraint — the layer that scales with a slider is not the layer that fails.
The database is where load actually concentrates, and the first work is always query-level rather than infrastructure-level. Run the slowest queries through EXPLAIN ANALYZE and read the plan rather than guessing. On this platform, the queries that mattered dropped from around 800ms to about 12ms once the plans were understood and the right indexes existed. No amount of additional application capacity would have produced that, and adding capacity before fixing it would have made things worse by pointing more concurrent work at the same slow queries.
Index deliberately rather than defensively. Every index accelerates reads and taxes writes, and an over-indexed table under write-heavy load becomes its own bottleneck. Add indexes in response to observed slow queries, not in anticipation of hypothetical ones.
Connection pooling is not optional above a few dozen instances
This is the failure that catches teams migrating from PHP to Node, and it catches them at the worst moment.
A PHP application typically opens a database connection per request and closes it at the end. A Node application holds a pool per process. Move to Node and scale horizontally, and connection count no longer tracks request concurrency — it tracks instance count multiplied by pool size, whether or not those connections are doing anything.
Postgres allocates real memory per connection and does not degrade gracefully when it runs out. It refuses new ones, which surfaces as your entire application failing simultaneously rather than slowing down.
PgBouncer in transaction pooling mode fixes this by multiplexing many application connections onto few database connections, handing a real connection to a transaction only for its duration. On this platform that took roughly 8,000 application connections down to 150 database connections, with about a fourfold throughput improvement — and the throughput gain was almost incidental. The point was that the ceiling stopped existing.
The constraint transaction pooling imposes is that session-level state does not survive between transactions. Prepared statements, session variables, and advisory locks behave differently. Check what your ORM assumes before switching modes, because this is the kind of change that works in testing and fails on a specific code path in production.
Cache the right data, and nothing else
Redis earns its place when it holds data that is expensive to compute and tolerable to serve slightly stale. It becomes a liability when it holds data that must be correct.
Product catalogue data, category listings, rendered fragments, and session data are good candidates: expensive to assemble, read constantly, and harmless if a few seconds behind. Inventory counts and pricing during a high-traffic sale are not, because the cost of being wrong is overselling stock you do not have.
The failure mode to design against is the stampede. When a popular key expires under heavy load, every request that misses it recomputes the same value simultaneously, and the database receives a burst precisely when it is least able to absorb one. Stagger expiry with jitter so keys do not fall due together, and serve stale data while a single refresh runs rather than letting every caller recompute.
Cache invalidation is where correctness is lost, so prefer short time-to-live values over clever invalidation logic wherever the data tolerates it. A five-second TTL you can reason about is worth more than a perfect invalidation scheme that has one path nobody remembers.
Match the compute model to the traffic shape
Traffic that is spiky and traffic that is steady want different infrastructure, and trying to serve both with one model means overpaying for the baseline or falling over during the spike.
The pattern that worked was a persistent baseline on ECS Fargate sized for ordinary load, with autoscaling headroom for the peak. Scheduled and burst work — image processing, feed generation, reconciliation — went to Lambda, where paying per invocation is correct precisely because the work is intermittent.
The detail that matters is that autoscaling is not instant. Container startup, health checks, and connection warm-up take time, and a spike that arrives faster than your scale-out will hit an undersized cluster. Scale ahead of known events rather than reacting to them. For a Black Friday, capacity goes up before the traffic does, and the cost of running over-provisioned for a day is trivially smaller than the cost of being down for an hour of it.
Load test the path that makes money
Load testing is worth very little if it tests the wrong thing. Hitting the homepage with a lot of requests measures your CDN.
Test the full path a paying customer takes — search, product page, add to cart, checkout — because that path touches the database writes, the session store, and the payment integration that actually constrain you. A system that serves a million cached homepage views and falls over at 200 concurrent checkouts is a system that will fail on the day it matters.
Test against production-scale data. Query plans change with table size, and a query that is fast against 10,000 rows can choose a different plan against two million. Testing against a small dataset validates that your code runs, not that it scales.
Then watch the right signals during the event. Error rate and p99 latency on the checkout path tell you whether customers are being served. Average response time across all routes does not — it will look reassuring while the small fraction of requests that generate revenue are timing out.
What did not need scaling
As much time is wasted scaling the wrong layer as is saved by scaling the right one, and the wrong layers are usually the visible ones.
Static assets needed no work beyond a CDN. Images, scripts, stylesheets, and fonts served from the edge never touched the origin, so they contributed nothing to the load problem regardless of traffic. This is the layer people optimise first because it is easy to measure, and it is almost never the constraint.
The application servers themselves needed capacity, not architecture. Once the database work was done, handling more traffic was a matter of running more containers. No code changes, no redesign — the horizontal layer behaved like a horizontal layer.
The admin and reporting interfaces needed nothing at all. They serve a handful of internal users, and their traffic does not correlate with customer traffic. Scaling them alongside the storefront would have been pure cost.
The honest generalisation: scale what concentrates. Anything where all traffic converges on a single shared resource — the database, the session store, a queue with one consumer — is where load becomes a problem. Anything that fans out across independent instances is a capacity question, and capacity questions are the easy kind.
Sequence matters more than any individual fix
Doing this work in the wrong order wastes most of it, because early fixes change what the later measurements say.
Profile the database and fix the query plans first, since every layer above it inherits that latency. Then fix connection handling, because it determines whether horizontal scaling helps or actively hurts. Then add caching, because you now know which queries are genuinely expensive rather than which ones merely looked slow behind a connection queue. Then size the compute, because only now does a load test measure the system you will actually run. Then load test the revenue path against production-scale data.
Caching before fixing query plans is the most common inversion, and it is seductive because it produces an immediate improvement. It also hides the underlying problem until the cache misses under peak load — which is exactly when the unfixed query runs, against a database that is already saturated, for every request at once.
After the peak
Scale down deliberately, and later than feels necessary. Traffic after a major sale does not return to baseline immediately, and return processing, customer service load, and delayed fulfilment work continue well past the event.
Capture the numbers while they are still available. Peak concurrency, p99 latency on the checkout path, database connection high-water mark, cache hit rate, and the queue depths — recorded during the event, these tell you which headroom was real and which was imagined. Recorded a week later, they are gone.
The most useful artefact from any traffic peak is a written note of what came closest to breaking. Not what broke — what nearly did. That is the list you work through before the next one, and it is only visible while the system is under genuine pressure.
Need help applying this to your project?
Book a free consultation →